What Does Language Look Like?
We experience language primarily through our ears. It’s a stream of sound—vibrations in the air that our brains miraculously decode into meaning. But what if you could see it? What if you could pause a spoken word in mid-air and examine its physical shape? This isn’t science fiction. It’s the daily work of phoneticians, speech engineers, and forensic analysts, and their essential tool is the spectrogram.
A spectrogram is a visual representation of sound, often called a “voiceprint.” It transforms the ephemeral, invisible waves of speech into a detailed, two-dimensional image. Think of it as sheet music for sound itself, but instead of notes on a staff, it shows the raw, acoustic energy that makes up every phoneme. By learning to read these images, we can unlock the hidden physical architecture of language.
The Anatomy of a Voiceprint
At first glance, a spectrogram can look like a messy, abstract barcode or a satellite weather map. But once you understand its axes, it becomes a rich source of information. Every spectrogram maps three fundamental properties of sound:
- Time (X-axis): This is the easiest part. The horizontal axis represents time, moving from left to right. A spectrogram of the word “hello” will show the sound events for “h,” “e,” “ll,” and “o” in sequence.
- Frequency (Y-axis): The vertical axis represents frequency, or pitch, measured in Hertz (Hz). Low-frequency sounds (like a deep hum) are at the bottom, while high-frequency sounds (like a hiss) are at the top.
- Intensity (Z-axis): The third dimension is intensity, or amplitude (loudness). This is shown by the darkness or color of the plot. The darker or more intense the color (often red in color spectrograms), the more acoustic energy is present at that specific time and frequency. Faint sounds are light grey, while loud sounds are black.
So, when you look at a spectrogram, you’re looking at a graph that says: “At this moment in time, these frequencies were this loud.”
Decoding the Building Blocks of Speech
The real magic happens when we start to identify the visual signatures of different speech sounds. Just as letters form words, distinct patterns on a spectrogram form phonemes.
Vowels: The Resonant Core
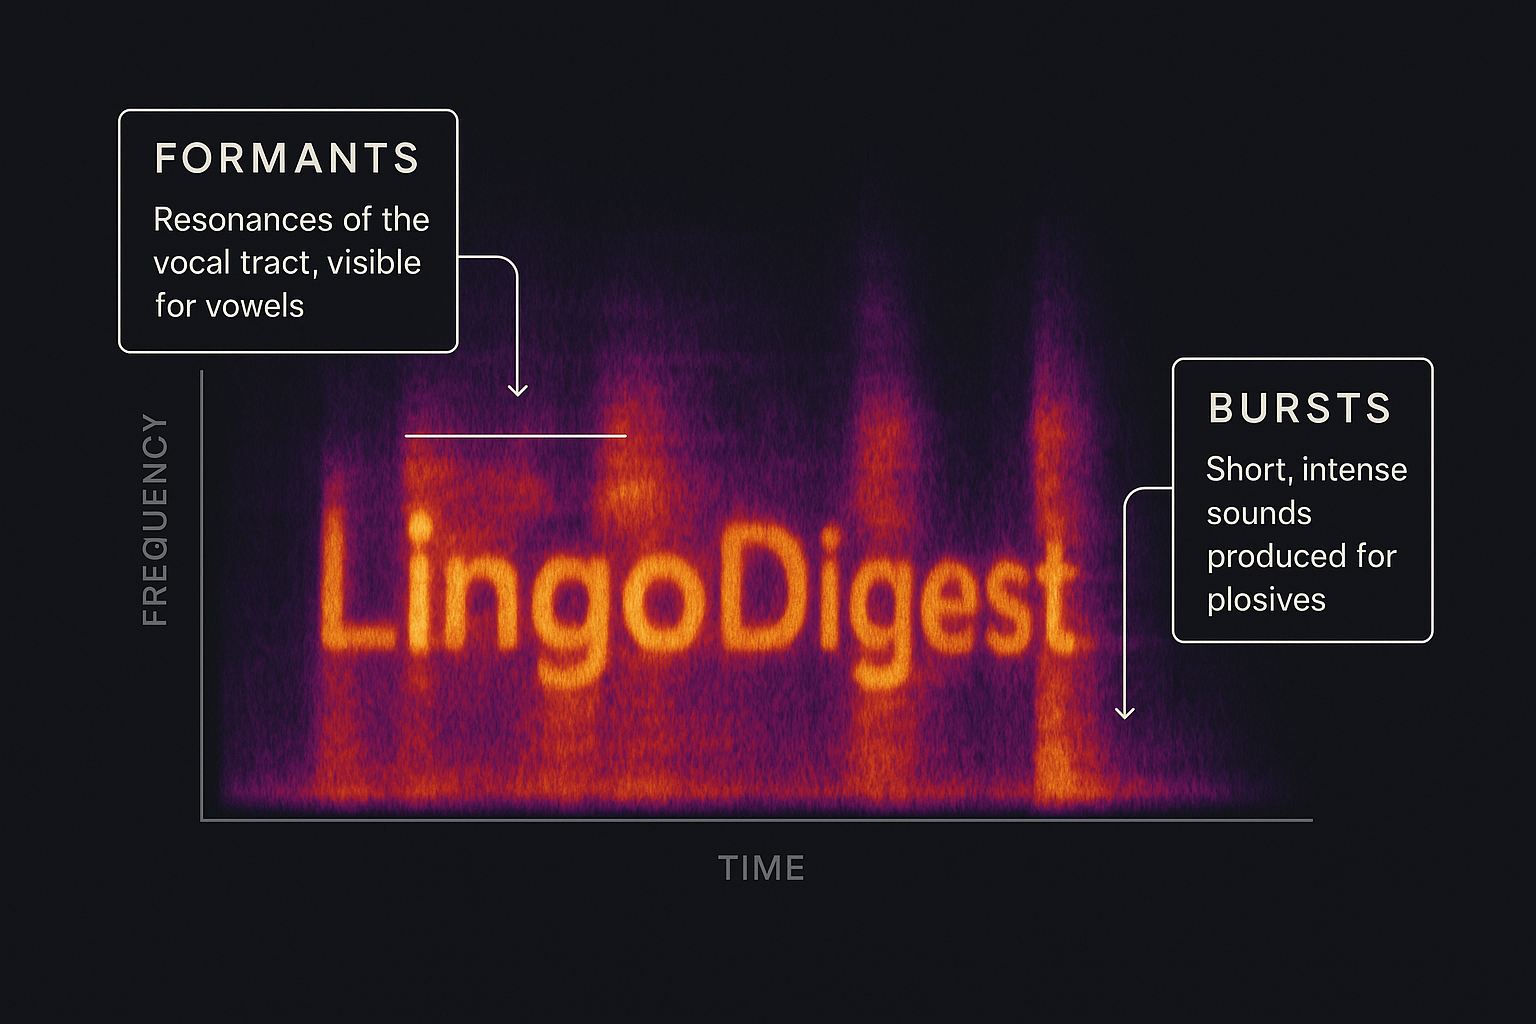
Vowels are the soul of a syllable. Acoustically, they are resonant sounds produced with an open vocal tract. On a spectrogram, they are easy to spot. They appear as dark, distinct horizontal bands called formants.
Formants are concentrations of acoustic energy at specific frequencies, created by the shape of your mouth. The position of the first two formants (F1 and F2) is crucial for distinguishing vowels:
- F1 (the lowest formant) relates to vowel height. A low F1 means a high vowel (like the “ee” in “heed”), because your tongue is high in your mouth. A high F1 means a low vowel (like the “a” in “had”), because your jaw is dropped and your tongue is low.
- F2 (the second formant) relates to vowel backness. A high F2 means a front vowel (like in “heed” or “had”), because your tongue is pushed forward. A low F2 means a back vowel (like the “oo” in “who’d”), because your tongue is pulled back.
This is why the spectrograms for “heed,” “had,” and “who’d” look so different. An entire accent, like the California Vowel Shift, can be visually mapped by tracking how the formants of a population’s vowels have moved over time.
Consonants: The Stops, Hisses, and Hums
If vowels are the resonant core, consonants are the sharp, percussive, and noisy elements that shape them. They look dramatically different on a spectrogram.
- Plosives (Stops): Sounds like /p/, /t/, and /k/ are made by stopping the airflow completely and then releasing it. This creates a clear visual signature: first, a blank or white vertical gap of silence (the stop), followed by a sharp, vertical spike of energy (the release burst). For voiceless stops like /p/, you might even see a puff of aspiration—a faint, scratchy patch of noise after the burst.
- Fricatives (Hisses): Sounds like /s/, /f/, and /ʃ/ (“sh”) are created by forcing air through a narrow channel. This produces turbulent, noisy friction. On a spectrogram, they look like a fuzzy, staticky cloud of energy. The /s/ sound is particularly dramatic, appearing as a very dark, high-frequency patch of noise that can extend to the top of the graph.
- Nasals: Sounds like /m/ and /n/ are produced by channeling air through the nose. They have formants like vowels, but they are much fainter and are accompanied by a strong, low-frequency band called a “nasal murmur.” The transition from a nasal to a vowel is often very clear.
- Approximants: Sounds like /l/ and /r/ are vowel-like but involve a quicker movement. The American /r/ is famous among phoneticians for its distinctive spectrogram, where the third formant (F3) takes a sharp dip.
More Than Just Pictures of Words
Spectrograms aren’t just an academic curiosity; they are a powerful tool with wide-ranging applications.
Forensic Linguistics: While not the infallible “voice fingerprint” that movies sometimes suggest, spectrograms are used in forensics. An analyst can compare a spectrogram from a threatening voicemail to one from a suspect. While not enough to convict on its own, it can be a powerful tool to either include or exclude a suspect, based on similarities in formant frequencies, speech rhythm, and other idiosyncratic features.
Speech Technology: Every time you talk to Siri, Alexa, or Google Assistant, you are relying on spectrograms. Speech recognition systems don’t “listen” to audio the way we do. They convert your speech into a spectrogram (or a similar representation) and use machine learning models to identify the patterns of phonemes and words. The same is true for text-to-speech engines that generate artificial voices.
Language Learning & Therapy: How do you teach a learner the subtle difference between the French “u” and “ou”? You can show them! Language learning apps and speech therapy software can display a student’s spectrogram next to a native speaker’s, providing instant visual feedback on their pronunciation.
Bioacoustics: Linguists aren’t the only ones reading spectrograms. Biologists use them to study animal communication. The intricate patterns of birdsong, the haunting calls of whales, and the chirps of dolphins are all analyzed visually to understand their structure, syntax, and meaning.
The Unseen Architecture of Language
The spectrogram pulls back the curtain on the physics of speech. It shows us that language isn’t just an abstract system of symbols but a tangible, physical phenomenon with a hidden visual structure. It reveals the intricate dance of muscles in our vocal tract, the precise shaping of air, and the acoustic energy that connects one human mind to another.
So the next time you speak, remember that your words are not just disappearing into the air. They are painting a picture—a complex, beautiful, and deeply personal voiceprint that tells the story of who you are, where you’re from, and exactly what you mean.